Documentation Revision Date: 2019-02-12
Dataset Version: 1
Summary
The Global Fire Atlas dataset tracks the day-to-day dynamics of individual fires based on moderate resolution burned area data. During 2003 - 2016, we identified about 13.3 million individual fires globally. For each individual fire, the dataset provides information on the timing and location of the ignition, the fire size, perimeter, duration, daily fire line, daily expansion, speed and direction of spread. Individual fire information and summary data products provide new information for benchmarking fire models within ecosystem and Earth system models, understanding vegetation-fire feedbacks, improving global emissions estimates, and characterizing the changing role of fire in the Earth system.
Data are produced in GIS file-formats (GeoTIFF and shapefiles) and are available as gridded 500-m global layers with corresponding vector shapefiles showing individual fire perimeters and ignition locations, as well as a monthly 0.25-degree aggregate product. The annual global shape files and 500-m gridded layers are produced for each fire season, a 12-month period centered on the month of peak-fire activity in each 10-degree x 10-degree MODIS tile. Because each 500-m pixel rarely burns twice during a single fire season, this format allows for annual 500 m data layers with minimal loss of information. In contrast, the 0.25-degree monthly layers are produced for each calendar year, with averages taken based on the fraction of burned area of each individual fire within the respective month and 0.25-degree grid cell.
There are 182 data files with this dataset which includes 28 annual shapefiles with ignition point or fire perimeter data and 154 GeoTIFF files (56 yearly and 98 monthly) with fire metrics.

Figure 1. Average fire duration (upper) and daily fire expansion (lower) displayed cumulatively for the 14 year study period, 2003-2016. From Andela et al., 2018.
Citation
Andela, N., D.C. Morton, L. Giglio, and J.T. Randerson. 2019. Global Fire Atlas with Characteristics of Individual Fires, 2003-2016. ORNL DAAC, Oak Ridge, Tennessee, USA. https://doi.org/10.3334/ORNLDAAC/1642
Table of Contents
- Dataset Overview
- Data Characteristics
- Application and Derivation
- Quality Assessment
- Data Acquisition, Materials, and Methods
- Data Access
- References
Dataset Overview
The Global Fire Atlas is a global dataset that tracks the day-to-day dynamics of individual fires to determine the timing and location of ignitions and fire size, duration, daily expansion, fire line length, speed, and direction of spread. These individual fire characteristics were derived base on the Global Fire Atlas algorithm and estimated day of burn information at 500-m resolution from the Moderate Resolution Imaging Spectroradiometer (MODIS) Collection 6 MCD64A1 burned area product. The algorithm identified 13.3 million individual fires (≥21 ha or 0.21 km2; the size of one MODIS pixel) over the 2003-2016 study period.
To isolate individual fires, clusters of adjacent burned area for a given fire season (12 months centered on the month of maximum burned area) were subdivided into individual fires based on the spatial structure of estimated burn dates in the MCD64A1 burned area product. The data were processed on a per-fire-season basis in each 10-degree x 10-degree MODIS tile. To address burn date uncertainty and distinguish individual fires, a filter was developed to adjust the burn date of local minima that do not correspond to ignition points. A “fire persistence” threshold was set that determined how long a fire may take to spread from one 500-m grid cell into the next, to distinguish individual fires that are adjacent but occurred at different times in the burning season. A second filter was developed to correct for outliers in the burn date that occurred along the edges of large fires. Based on the algorithm, burned area was broken down into seven fire characteristics noted above.
Global Fire Atlas data are provided as 1) per-fire-year shapefiles of the ignition locations (point) and individual fire perimeters (polygon) with attributes of unique fire ID, ignition location, start and end dates, size, duration, and average values of the daily expansion, daily fire line, speed, and direction of spread; 2) annual 500-m resolution gridded files of individual fire daily day of burn, fire line, speed, and direction; and 3) monthly 0.25-degree gridded layers for fire ignitions, size, duration, fire line, speed, direction, and spread that are averages based on the fraction of burned area of each individual fire within the respective month and 0.25-degree grid cell.
Project: Carbon Monitoring System
The NASA Carbon Monitoring System (CMS) is designed to make significant contributions in characterizing, quantifying, understanding, and predicting the evolution of global carbon sources and sinks through improved monitoring of carbon stocks and fluxes. The System will use the full range of NASA satellite observations and modeling/analysis capabilities to establish the accuracy, quantitative uncertainties, and utility of products for supporting national and international policy, regulatory, and management activities. CMS will maintain a global emphasis while providing finer scale regional information, utilizing space-based and surface-based data and will rapidly initiate generation and distribution of products both for user evaluation and to inform near-term policy development and planning.
Related Publication:
Andela, N., Morton, D.C., Giglio, L., Paugam, R., Chen, Y., Hantson, S., van der Werf, G.R., and Randerson, J.T. 2018. The Global Fire Atlas of individual fire size, duration, speed, and direction, Earth System Science Data (in review), https://doi.org/10.5194/essd-2018-89.
Acknowledgements
This work was supported by NASA’s Carbon Monitoring System program (grant 80NSSC18K0179) and the Gordon and Betty Moore Foundation (grant GBMF3269).
Data Characteristics
Spatial Coverage: Global
Spatial Resolution: 500-m (annual) and 0.25-degree (monthly)
Temporal Coverage: Data cover the years 2003 - 2016
Temporal Resolution: Annual and monthly
Study Area: (All latitudes and longitudes are given in decimal degrees)
|
Site |
Westernmost Longitude |
Easternmost Longitude |
Northernmost Latitude |
Southernmost Latitude |
|---|---|---|---|---|
|
Global (annual files) |
-166.2880556 |
107.8133333 |
70 |
-60 |
|
Global (monthly files) |
-180 | 180 | 90 | -90 |
Data File Information
There are 182 data files with this dataset which includes 28 annual shapefiles and 154 GeoTIFF files (56 yearly and 98 monthly).
- The annual global Shapefiles and 500-m gridded layers (yearly files) are produced for each fire season, a 12-month period centered on the month of peak-fire activity in each 10-degree x 10-degree MODIS tile.
- The monthly data are averages taken based on the fraction of burned area of each individual fire within the respective month and 0.25-degree grid cell.
Table 1. File names and descriptions
|
File Name |
Description |
|---|---|
|
Global_fire_atlas_V1_X_YYYY.zip (28 Shapefiles)
|
These files are annual Shapefiles (.shp) in compressed .zip format where: X is perimeter or ignitions and YYYY is 2003-2016. The perimeter files are polygon areas. The ignition files provide the point locations of the pixel where a fire started. Additional attributes are provided in Table 2. |
|
Global_fire_atlas_X_yearly_YYYY.tif (56 yearly files) |
Yearly data in GeoTIFF (.tif) format (500-m) where: X is day of burn, fire line, speed, or direction, and YYYY is 2003-2016. These underlying 500-m gridded layers reflect the day-to-day behavior of the individual fires. |
|
Global_fire_atlas_X_monthly_YYYY.tif (98 monthly files) |
Monthly data in GeoTIFF (.tif) format (0.25-degree) where: X is ignitions, size, duration, fire line, speed, direction, or spread, and YYYY is 2003-2016. Monthly data are provided as one 12-band geotiff per year. The monthly data are averages taken based on the fraction of burned area of each individual fire within the respective month and 0.25-degree grid cell. |
Shapefile Properties
Spatial Reference System, EPSG: 4326
Shapefile Attributes
Table 2. Attributes in the shapefiles
Global per-fire-year shapefiles of the ignition locations (point) and individual fire perimeters (polygon) contain attribute tables with a unique fire ID, ignition location, start and end dates, size, duration, and average values of the daily expansion, daily fire line, speed, and direction of spread.
| Attribute | Units/format | Description |
|---|---|---|
| fire_ID | Unique fire identifier number | |
| lat | Decimal degrees | Latitude of the ignition location |
| lon | Decimal degrees | Longitude of the ignition location |
| start_ date | YYYY-MM-DD | Ignition date |
| start_DOY | Ignition day of year | |
| end_date | YYYY-MM-DD | Extinction date |
| end_DOY | Extinction day of year | |
| perimeter | Km | Final perimeter |
| size | Km2 | Total area burned per fire |
| duration | Days | Fire duration |
| fire_line | Km | Average daily fire line length |
| expansion | Km2/day | Average daily fire expansion |
| speed | Km/day | Average speed of the fire |
| direction | Dominant direction of spread (numerical), only provided for multiday fires: (0) indicates no data, (1) north, (2) northeast, (3) east, (4) southeast, (5) south, (6) southwest, (7) west, and (8) northwest | |
| direction_s | Dominant direction of spread (string), only provided for multiday fires: (0) indicates no data, (1) north, (2) northeast, (3) east, (4) southeast, (5) south, (6) southwest, (7) west, and (8) northwest | |
| landcover | Dominant land cover type (numerical). The dominant land cover type was derived from MODIS MCD12Q1 collection 5.1 data for 2012 using the University of Maryland (UMD) classification (Friedl et al., 2002) | |
| landcover_s | Dominant land cover type (string). The dominant land cover type was derived from MODIS MCD12Q1 collection 5.1 data for 2012 using the University of Maryland (UMD) classification (Friedl et al., 2002) | |
| tile_ID | MODIS tile (h, v) |
GeoTIFF Properties
Yearly files:
No Data Value: -9999
Pixel size: nominally 500-m x 500-m
Band: 1
Spatial Reference System, proj4: +proj=sinu +lon_0=0 +x_0=0 +y_0=0 +a=6371007.181 +b=6371007.181 +units=m +no_defs
Monthly files:
No Data Value: -9999
Pixel size: 0.25-degree x 0.25-degree
Bands: 12 (Monthly data are provided as one 12-band GeoTIFF per year.)
Spatial Reference System, EPSG: 4326
GeoTIFF Variables
Yearly data: Each file provides data for one variable for each year, 2003-2016. These underlying 500-m gridded layers reflect the day-to-day behavior of the individual fires.
Table 3. Data in the yearly files (500-m gridded). Gridded 500-m global maps of the Global Fire Atlas provide adjusted burn dates, daily fire line (DOY), speed, and direction of spread in GeoTIFF format.
| Variable/file | Units/format | Description |
|---|---|---|
| fire_line | DOY |
In this gridded file, "fire_line" is the day-of-year a certain pixel was on the fire line.
|
| speed | Km/day | Speed of the fire |
| direction | Dominant direction of spread (numerical), only provided for multiday fires: (0) indicates no data, (1) north, (2) northeast, (3) east, (4) southeast, (5) south, (6) southwest, (7) west, and (8) northwest | |
| day_of_burn | DOY | Day of burn |
Monthly data:
Data are summarized in the monthly 0.25-degree gridded products based on average values of individual fires. In contrast to the annual 500-m gridded files and shapefiles, the monthly layers are averages taken based on the fraction of burned area of each individual fire within the respective month and 0.25-degree grid cell. For example, a grid cell containing a 1-km2 fire and a 99-km2 fire would have an average fire size of 50 km2 [(1+99)/2] for that given month; in case half of the 99-km2 fire occurred in a different month, the average fire size would become 33.7 km2 [(1+99*0.5)/1.5]. For some applications, it may be useful to take averages weighted by the individual fire size, as that might be more representative for the typical impact of fire activity on the landscape (Andela et al., 2018).
Table 4. Data in the monthly files. Each monthly file provides averages for one of the variables described below, based on the fraction of burned area of each individual fire within the respective month and 0.25-degree grid cell. Note that monthly data are provided as one 12-band GeoTIFF per year.
| Variables | Units/format | Description |
|---|---|---|
| ignitions | Number/ month | Monthly ignition count |
| size | km2 | Average per fire-total area burned |
| duration | Days | Average per fire duration |
| fire_line | km |
Average fire line length. The estimates of fire line length were based on the 500-m gridded daily perimeter of the fire, where we assumed that once the fire reaches the edge of the burn scar, this part of the perimeter stops burning after one day. Based on the 500-m DOY I estimate a daily fire line length in km. These numbers represent the average across days. |
| speed | km/day | Average per fire speed |
| direction | Dominant per fire direction of spread. Dominant direction of spread (numerical), only based on multiday fires: (1) north, (2) northeast, (3) east, (4) southeast, (5) south, (6) southwest, (7) west, and (8) northwest | |
| spread | km2/day | Average per fire daily expansion |
Data Processing by the Data Center
The ORNL DAAC made several modifications to the Fire Atlas data products.
Annual GeoTIFFs:
- Replaced all values of 0 with -9999 and set nodata value as -9999. There are no zero (0) data values in any of the annual fire metrics.
Monthly GeoTIFFs:
- Stacked the monthly fire metrics for a year to be one 12-band GeoTIFF per year. The DAAC received them as one GeoTIFF per month.
- Renamed the 12-band monthly files to have similar filenames as the annual files. For example, renamed from Duration_200801.tif, Duration_200802.tif, …, Duration_200812.tif to Global_fire_atlas_duration_monthly_2008.tif.
Shapefiles:
- No changes.
Application and Derivation
Individual fire information and summary data products provide new information for benchmarking fire models within ecosystem and Earth system models, understanding vegetation-fire feedbacks, improving global emissions estimates, and characterizing the changing role of fire in the Earth system.
Quality Assessment
Data validation included:
- The date of active fire detections from the Visible Infrared Imaging Radiometer Suite (VIIRS) instrument aboard the Suomi National Polar-orbiting Partnership (Suomi-NPP) satellite within each larger 500-m MODIS grid cell (based on VIIRS center point) was compared to the adjusted MCD64A1 day of burn to understand the temporal precision of the derived Global Fire Atlas products.
- Fire perimeters from the Global Fire Atlas were compared to fire perimeter estimates from the Monitoring Trends in Burn Severity (MTBS) project during their overlapping period (2003 – 2015). See Andela et al. 2018.
Data Acquisition, Materials, and Methods
The Global Fire Atlas algorithm and estimated day of burn information at 500-m resolution from the Moderate Resolution Imaging Spectroradiometer (MODIS) collection 6 burned area dataset (Giglio et al., 2018) were used to derive this dataset. Based on the Global Fire Atlas algorithm, burned area was broken down into seven fire characteristics in three steps (Fig. 2). First, burned area was described as the product of ignitions and individual fire sizes. Second, fire size was further separated into fire duration and a daily expansion component. Third, the daily fire expansion was subdivided into fire speed, the length of the fire line, and the direction of spread.
Individual fires: ignitions, size, perimeter and duration
To isolate individual fires, clusters of adjacent burned area for a given fire season (12 months centered on the month of maximum burned area) were subdivided into individual fires based on the spatial structure of estimated burn dates in the MCD64A1 burned area product. The data were processed on a per-fire-season basis in each 10-degree x 10-degree MODIS tile. To locate candidate ignition points within each burned area cluster, the “local minima,” were mapped and defined as a single grid cell or group of adjacent grid cells with the same burn date surrounded by grid cells with later burn dates.
A three-step procedure was applied to address burn date uncertainty and distinguish individual fires. First, a filter was developed to adjust the burn date of local minima that do not correspond to ignition points. Second, a “fire persistence” threshold was set that determined how long a fire may take to spread from one 500-m grid cell into the next, to distinguish individual fires that are adjacent but occurred at different times in the burning season. Third, a second filter was developed to correct for outliers in the burn date that occurred along the edges of large fires.
The ignition point filter is based on the assumption that the fires progress in a logical manner through space and time. First, all local minima were mapped within the original field of burn dates. Next, each local minimum was replaced by the nearest later burn date in time of the surrounding grid cells, and a new map of local minima was created. If the original local minimum remained as a part of a new, larger local minimum with a later burn date, the fire followed a logical progression in time and space and the original local minimum was retained. If the local minimum disappeared, the original local minimum was likely the product of an inconsistency within the field of burn dates rather than a true ignition point and the burn date was adjusted forward in time to remove the original local minimum. This step can be repeated several times, with each new iteration further reducing the number of local minima and increasing the confidence in ignition points, but, each iteration may also result in greater adjustment of the original burn date. Here we implemented three iterations of the ignition point filter to remove most local minima that did not spread forward in time while limiting the scope of burn date adjustments.
To establish the location and date of ignition points, as well as to track the daily growth and extent of individual fires, a “fire persistence” threshold was used to determine how long a fire may take to spread from one grid cell into the next, taking both fire spread rate and satellite coverage into account. Using such a threshold is particularly important to distinguish individual fires in frequently burning savannas and highly fragmented agricultural landscapes, where many individual small fires may occur within a relatively short time span. Because there are no reference datasets on global fire persistence, a spatially-varying fire persistence threshold was used that depends on fire frequency (Andela et al., 2018). These threshold values broadly correspond to biomes, with shorter persistence values for tropical regions and human-dominated landscapes, and longer threshold values for temperate and boreal ecosystems with high fuel loads.
Based on the location and date of the established ignition points and the fire persistence thresholds, the growth of each individual fire was tracked through time to determine its size, perimeter, and duration. For each day of year, individual fires were allowed to grow into the areas that burned on that specific day, as long as the difference in burn dates between two pixels was equal to or smaller than the fire persistence threshold of the pixel of origin.
Burn date uncertainty may also lead to multiple “extinction points,” outliers in the estimated day of burn along the edges of a fire. A second filtering step was therefore used to adjust the burn date for extinction points, if required (Andela et al., 2018).
Daily fire expansion: fire line, speed, and direction of spread
The day of burn estimates were used to track the daily expansion (km2/day) and length of the fire line (km) for each individual fire. The daily estimates of fire line length were based on the daily perimeter of the fire, where it was assumed that once the fire reaches the edge of the burn scar, this part of the perimeter stops burning after one day. The expansion of the fire (km2/day) is the area burned by a fire each day. To estimate the speed and direction of spread, the “most likely” path of the fire was calculated to reach each individual 500-m grid cell based on shortest distance. For each grid cell the shortest route was estimated to connect the grid cell between two points: 1) the nearest point on the fire line with the same day of burn and 2) the nearest point on the previous day’s fire line. This route was forced to follow areas burned on the specific day. For each point on this route, or “fire path,” the speed of the fire (km/day) was estimated as the length of the path (km) divided by one day and the direction, as the direction of the next grid cell on the fire path. Since each grid cell is surrounded by eight other grid cells, this resulted in eight possible spread directions: north, northeast, east, southeast, south, southwest, west, and northwest. Fires of all sizes that burned on a single day were not assigned a direction of spread. Estimates of both speed and direction were corrected for the orientation between 500-m grid cells on the MODIS sinusoidal projection that varies with location. When a particular grid cell formed part of multiple “fire paths,” the earliest time of arrival or the highest fire speed and corresponding direction of spread were retained (Andela et al., 2018).
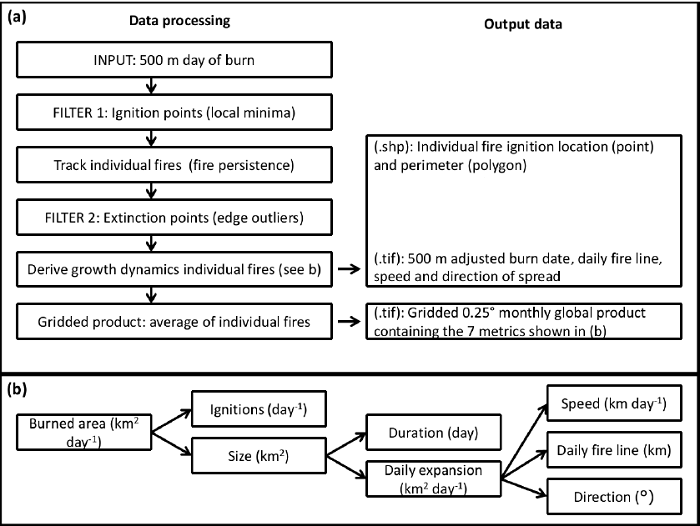
Figure 2: Flow chart showing the (a) data-processing steps and resulting products, and (b) the decomposition of burned area into seven different components of the fire regime in the Global Fire Atlas (Andela et al., 2018).
Data Access
These data are available through the Oak Ridge National Laboratory (ORNL) Distributed Active Archive Center (DAAC).
Global Fire Atlas with Characteristics of Individual Fires, 2003-2016
Contact for Data Center Access Information:
- E-mail: uso@daac.ornl.gov
- Telephone: +1 (865) 241-3952
References
Andela, N., Morton, D.C., Giglio, L., L., Paugam, R., Chen, Y., Hantson, S., van der Werf, G.R., and Randerson, J.T. 2018. The Global Fire Atlas of individual fire size, duration, speed, and direction, Earth System Science Data (in review), https://doi.org/10.5194/essd-2018-89.
Friedl, M.A., Mclver, D.K., Hodges, J.C.F., Zhang, X.Y., Muchoney, D., Strahler, A.H., Woodcock, C.E., Gopal, S., Schneider, A., Cooper, A., Baccini, A., Gao, F. and Schaaf, C. 2002. Global land cover mapping from MODIS: algorithms and early results, Remote sensing of environment, 83, 287–302, https://doi.org/10.1016/S0034-4257(02)00078-0
Giglio, L., Boschetti, L., Roy, D. P., Humber, M. L., and Justice, C. O. 2018. The Collection 6 MODIS burned area mapping algorithm and product. Remote sensing of environment, 217, 72-85. https://doi.org/10.1016/j.rse.2018.08.005