Documentation Revision Date: 2018-12-31
Data Set Version: 1
Summary
The dataset includes 4 data files in *.csv format and one additional companion file.

Figure 1: Toolik Lake Permanent Vegetation Plot SWT-16.
Citation
Walker, D.A. 2018. Arctic Vegetation Plots at Toolik Lake, Alaska, 1989. ORNL DAAC, Oak Ridge, Tennessee, USA. https://doi.org/10.3334/ORNLDAAC/1333
Table of Contents
- Data Set Overview
- Data Characteristics
- Application and Derivation
- Quality Assessment
- Data Acquisition, Materials, and Methods
- Data Access
- References
Data Set Overview
This dataset provides environmental, soil, and vegetation data collected in August 1989 from 81 study plots at the Toolik Lake research site, located in the southern Arctic Foothills of the Brooks Range, Alaska. Data includes the baseline plot information for vegetation, soils, and site factors for the study plots subjectively located in 26 communities and 4 broad habitat types across the glaciated landscape. Specific attributes include: dominant vegetation species, cover, indices, and biomass pools; soil chemistry, physical characteristics, moisture, and organic matter. This product brings together for easy reference all the available information collected from the plots that has been used for the classification, mapping, and analysis of geobotanical factors in the Toolik Lake region and across Alaska.
The Pre-ABoVE vegetation plot datasets were curated to create the Alaska Arctic Vegetation Archive (AVA-AK; Walker et al. 2016b, Walker 2013). The AVA-AK is a regional database that is part of the larger Arctic Vegetation Archive (Walker 2016a, Walker et al. 2013, Walker and Raynolds 2011). The database contains vegetation plots from homogeneous plant communities with tables of cover or cover-abundance scores for all species and accompanying environmental site data. Field data were collected using Braun-Blanquet, US National Vegetation Classification protocols, or comparable methods.
Project: Arctic-Boreal Vulnerability Experiment (ABoVE)
The Arctic-Boreal Vulnerability Experiment (ABoVE) iis a NASA Terrestrial Ecology Program field campaign that will take place in Alaska and western Canada between 2016 and 2021. Climate change in the Arctic and Boreal region is unfolding faster than anywhere else on Earth. ABoVE seeks a better understanding of the vulnerability and resilience of ecosystems and society to this changing environment.
Acknowledgements:
These data files were edited by Donald A. Walker, Amy L. Breen and Lisa A. Druckenmiller at the University of Alaska Fairbanks' Alaska Geobotany Center and obtained via the Arctic Geoecological Atlas (http://arcticatlas.geobotany.org/), which provides access to existing Arctic vegetation plot and map data in support of the ABoVE campaign.
Data Characteristics
Spatial Coverage: Area surrounding Toolik Lake, Alaska
ABoVE Grid Location: Ah1v0.Bh2v3
Spatial Resolution: Point samples
Temporal Coverage: 19890801 to 19890824
Temporal Resolution: Each plot was sampled once
Study Area: (All latitude and longitude given in decimal degrees)
|
Site |
Westernmost Longitude |
Easternmost Longitude |
Northernmost Latitude |
Southernmost Latitude |
|
Toolik Lake, Alaska |
-149.6506 |
-149.5873 | 68.6430 | 68.6228 |
Data File Information: There are four data files with this dataset in comma-separated (.csv) format.
Table 1. Data files
|
Data File Name |
Description |
|
Toolik_Lake_Soil_Data.csv |
Soil characterization data for Toolik Lake research plots |
|
Toolik_Lake_Species_Data.csv |
Species cover data for Toolik Lake research plots |
|
Toolik_Lake_Spectral_Biomass_Data.csv |
NDVI, LAI, iPAR and above ground biomass data for Toolik Lake research plots |
|
Toolik_Lake_Environmental_Data.csv |
Comprehensive set of environmental characterization data for Toolik Lake research plots including the descriptive site factors. Most measurement data have been processed to provide values at a common 10 cm depth. This measurement comparability facilitates analysis of geobotanical relationships across Alaska. |
Data Descriptions: The column names, their units and descriptions for each of the *.csv data files are listed below.
Table 2. Toolik_Lake_Soil_Data.csv
| Column Name | Units | Description |
| SAMPLE_NO | Soil Sample number | |
| PLOT_NO | Plot number where the soil sample was collected | |
| HORIZON | Soil horizon | |
| DEPTH | CM | Depth of the soil layer |
| WET_COLOR | MUNSELL | Color of wet soil in the soil sample following Munsell System of Color Notation |
| BULK_DENSITY | G/CC | Bulk density of the soil sample |
| GRAVEL_GREATER_THAN_2MM | % | Percentage of gravel that were greater than 2 mm in size in the soil sample |
| SAND | % | Percentage of sand in the soil sample |
| SILT | % | Percentage of silt in the soil sample |
| CLAY | % | Percentage of clay in the soil sample |
| TEXTURE | Texture of the soil in the soil sample | |
| WATER_GRAVIMETRIC | % | Gravimetric water content in the soil sample |
| WATER_FIELD_CAPACITY_0_33_ATM | % | Percentage of moisture content in the soil sample at 15 atmospheres of pressure |
| WATER_WILTING_POINT_15_ATM | % | Percentage of moisture content in the soil sample at 1/3 atmosphere of pressure |
| ORGANIC_MATTER | % | Percentage of organic matter in the soil sample |
| PH_PASTE | PH of the soil sample | |
| ELECTRICAL_ CONDUCTIVITY_PASTE | MMHOS/CM | Electrical conductivity of the soil sample |
| NO3_NH4HCO3_DTPA_EXTRACT | ppm | Extractable NO3-NH4HCO3 in the soil sample |
| P_NH4HCO3_DTPA_EXTRACT | ppm | Extractable P in the soil sample |
| K_NH4HCO3_DTPA_EXTRACT | ppm | Extractable K in the soil sample |
| ZN_NH4HCO3_DTPA_EXTRACT | ppm | Extractable Zn in the soil sample |
| FE_NH4HCO3_DTPA_EXTRACT | ppm | Extractable Fe in the soil sample |
| MN_NH4HCO3_DTPA_EXTRACT | ppm | Extractable Mn in the soil sample |
| CU_NH4HCO3_DTPA_EXTRACT | ppm | Extractable Cu in the soil sample |
| CA_NH4OAC_EXTRACT | MEQ/100 G | Extractable Ca in the soil sample |
| MG_NH4OAC_EXTRACT | MEQ/100 G | Extractable Mg in the soil sample |
| NA_NH4OAC_EXTRACT | MEQ/100 G | Extractable Na in the soil sample |
| K_NH4OAC_EXTRACT | MEQ/100 G | Extractable K in the soil sample |
| CACO3_EQUIVALENT | % | CACO3 equivalent in the soil sample |
| CATION_EXCHANGE_CAPACITY | MEQ/100 G | Cation exchange capacity of the soil sample |
| P_BRAY_METHOD | ppm | Available P in the soil as detected by Bray method |
Table 3. Toolik_Lake_Spectral_Biomass_Data.csv
| Column Name | Units | Description |
| SITE | Toolik Lake | |
| PLOT_NUMBER | Plot Number | |
| MICROSITE | Microsite description of the plots | |
| PLOT_ID | Combination of plot number and microsite | |
| PHYSIOGRAPHIC_CATEGORY | Physiographic category | |
| ACIDIC_NONACIDIC | Description of acidic/non-acidic | |
| ALLIANCE | Vegetation alliance | |
| ASSOCIATION_NAME | Vegetation association name | |
| SUBASSOCIATION | Vegetation subassociation | |
| RED_BAND | % | Red/visible band |
| NIR_BAND | % | Near-infrared |
| SAVI | Soil Adjusted Vegetation Index | |
| NDVI | Normalized Difference Vegetation Index | |
| 2ND_DERIV_AT_695NM | 2nd Derivative at 695NM | |
| 2ND_DERIV_AT_743NM | 2nd Derivative at 743 NM | |
| TRANSMITTED | % | Percentage of transmitted radiation |
| IPAR | % | Percentage of incidental photosynthetically active radiation |
| 0_58K_LAI | 0.58K Leaf Area Index | |
| 0_65K_LAI | 0.65K Leaf Area Index | |
| 0_61K_LAI | 0.61K Leaf Area Index | |
| MEAN_LAI | Average Leaf Area Index | |
| PLOT_AVERAGE_LAI | Average Leaf Area Index for the plot | |
| PLOT_AVERAGE_NDVI | Average Normalized Difference Vegetation Index for the plot | |
| LIVE_GRAMINOID | G/SQUARE METER | Amount of live graminoid |
| DEAD_GRAMINOID | G/SQUARE METER | Amount of dead graminoid |
| LIVE_FORB | G/SQUARE METER | Amount of live forb |
| DEAD_FORB | G/SQUARE METER | Amount of dead forb |
| LIVE_DECIDUOUS_SHRUB | G/SQUARE METER | Amount of live deciduous shrub |
| DEAD_DECIDUOUS_SHRUB | G/SQUARE METER | Amount of dead deciduous shrub |
| WOODY_DECIDUOUS_SHRUB | G/SQUARE METER | Amount of woody deciduous shrub |
| LIVE_EVERGREEN_SHRUB | G/SQUARE METER | Amount of live evergreen shrub |
| DEAD_EVERGREEN_SHRUB | G/SQUARE METER | Amount of dead evergreen shrub |
| WOODY_EVERGREEN_SHRUB | G/SQUARE METER | Amount of woody evergreen shrub |
| SPHAGNUM | G/SQUARE METER | Amount of sphagnum |
| OTHER_MOSS | G/SQUARE METER | Amount of other types of moss |
| LICHENS | G/SQUARE METER | Amount of lichens |
| MISCELLANEOUS_DEAD | G/SQUARE METER | Other vegetation types that are dead |
| ALGAE | G/SQUARE METER | Amount of algae |
| LIVE_EQUISETUM | G/SQUARE METER | Amount of live equisetum |
| DEAD_EQUISETUM | G/SQUARE METER | Amount of dead equisetum |
| AQUATIC_MOSS | G/SQUARE METER | Amount of aquatic moss |
| TOTAL_BIOMASS | G/SQUARE METER | Amount of total biomass |
| GREEN_BIOMASS_INCLUDING_LICHENS | G/SQUARE METER | Amount of green biomass including lichens |
| GREEN_BIOMASS_WITHOUT_LICHENS | G/SQUARE METER | Amount of green biomass excluding lichens |
Table 4. Toolik_Lake_Environmental_Data.csv
|
Column Name |
Units |
Description |
|
FIELD_PLOT_NUMBER |
|
Field plot number |
|
PRINCIPAL_HABITAT |
|
Principal habitat in the plot |
|
PRELIMINARY_COMMUNITY_NAME |
|
Preliminary vegetation type within the plots based on habitat and dominant species |
|
PLANT_COMMUNITY |
|
Primary vegetation types |
|
MICROSITE |
|
Detailed description of microsite within the plots |
|
DATE_SAMPLED |
YYYYMMDD |
Sampling date |
|
LATITUDE |
DD |
Latitude of the center of the plots |
|
LONGITUDE |
DD |
Longitude of the center of the plots |
|
LANDFORM |
|
Landform of the plots |
|
LANDFORM_DESC |
|
Description of landforms of the plots |
|
SURFICIAL_GEOLOGY |
|
Surficial geology of the plots |
|
SURFICIAL_GEOLOGY_DESC |
|
Description of surficial geology of the plots |
|
GLACIAL_GEOLOGY |
|
Glacial geology of the plots |
|
GLACIAL_GEOLOGY_DESC |
|
Description of glacial geology of the plots |
|
SURFICIAL_GEOMORPHOLOGY |
|
Surficial geomorphology of the plots |
|
SURFICIAL_GEOMORPHOLOGY_DESC |
|
Description of surficial geomorphology of the plots |
|
MICROSITE |
|
Microsite of the plots |
|
MICROSITE_DESC |
|
Description of microsite of the plots |
|
TOPOGRAPHIC_POSITION |
|
Topographic position of the plots |
|
TOPOGRAPHIC_POSITION_DESC |
|
Description of the topographic position of the plots |
|
SLOPE |
Degrees |
Slope of the plots |
|
ASPECT |
Degrees |
Aspect of the plots |
|
EXPOSURE |
|
Exposure of the plots |
|
EXPOSURE_DESC |
|
Description of the exposure of the plots |
|
SITE_MOISTURE |
|
Site moisture of the plots |
|
SITE_MOISTURE_DESC |
|
Description of the site moisture of the plots |
|
ESTIMATED_SNOW_DURATION |
|
Estimated snow duration within the plots |
|
ESTIMATED_SNOW_DURATION_DESC |
|
Description of estimated snow duration within the plots |
|
STABILITY |
|
Stability of the plots |
|
STABILITY_DESC |
|
Description of stability of the plots |
|
CRYOTURBATION |
|
Cryoturbation within the plots |
|
MICRORELIEF_HEIGHT |
CM |
Microrelief height of the plots |
|
THAW_DEPTH |
CM |
Depth to permafrost of the plots |
|
WATER_COVER |
% |
Percentage of water cover in the plot |
|
BARE_SOIL_COVER |
% |
Percentage of bare soil cover in the plot |
|
ROCK_COVER |
% |
Percentage of rock cover in the plot |
|
SOIL_UNITS |
|
Soil units in the plot |
|
SOIL_UNITS_DESC |
|
Description of the soil units within the plot |
|
SOIL_MOISTURE |
|
Soil moisture content within the plots |
|
SOIL_MOISTURE_DESC |
|
Description of the soil moisture content within the plots |
|
TALL_SHRUB_COVER |
% |
Percentage of tall shrub cover in the plot |
|
LOW_SHRUB_COVER |
% |
Percentage of low shrub cover in the plot |
|
DWARF_SHRUB_COVER |
% |
Percentage of dwarf shrub cover in the plot |
|
MEAN_SHRUB_HEIGHT |
CM |
Average shrub height within the plot in the plot |
|
GRAMINOID_COVER |
% |
Percentage of graminoid cover in the plot |
|
FORB_COVER |
% |
Percentage of forb cover in the plot |
|
LICHEN_COVER |
% |
Percentage of lichen cover in the plot |
|
BRYOPHYTE_COVER |
% |
Percentage of bryophyte cover in the plot |
|
HORSETAIL_COVER |
% |
Percentage of horsetail cover in the plot |
|
DISTURBANCE_HUMAN |
|
Disturbance by humans |
|
DISTURBANCE_HUMAN_DESC |
|
Description of disturbance by humans |
|
DISTURBANCE_FOX |
|
Disturbance by fox |
|
DISTURBANCE_FOX_DESC |
|
Description of disturbance by fox |
|
DISTURBANCE_BEAR |
|
Disturbance by bear |
|
DISTURBANCE_BEAR_DESC |
|
Description of disturbance by bear |
|
DISTURBANCE_CARIBOU |
|
Disturbance by caribou |
|
DISTURBANCE_CARIBOU_DESC |
|
Description of disturbance by caribou |
|
DISTURBANCE_SQUIRREL |
|
Disturbance by squirrel |
|
DISTURBANCE_SQUIRREL_DESC |
|
Description of disturbance by squirrel |
|
DISTURBANCE_LEMMING_VOLE |
|
Disturbance by lemming vole |
|
DISTURBANCE_LEMMING_VOLE_DESC |
|
Description of disturbance by lemming vole |
|
DISTURBANCE_MOOSE |
|
Disturbance by moose |
|
DISTURBANCE_MOOSE_DESC |
|
Description of disturbance by moose |
|
DISTURBANCE_BIRD |
|
Disturbance by birds |
|
DISTURBANCE_BIRD_DESC |
|
Description of disturbance by birds |
|
DISTURBANCE_INSECT |
|
Disturbance by insect |
|
DISTURBANCE_INSECT_DESC |
|
Description of disturbance by insect |
|
HORIZON_AT_10_CM |
|
Soil horizon at 10 cm depth |
|
HORIZON_DEPTHS |
CM |
Depth of the soil horizon |
|
WET_COLOR_AT_10_CM |
MUNSELL |
Color of wet soil at 10 cm depth following Munsell System of Color Notation |
|
BULK_DENSITY_AT_10_CM |
gm/cm^3 |
Bulk density of the soil at 10 cm depth |
|
GRAVEL_GT_THAN_2MM_AT_10_CM |
% |
Percentage of gravel that were greater than 2 mm in size in the soil at 10 cm depth |
|
SAND_AT_10_CM |
% |
Percentage of sand in the soil at 10 cm depth |
|
SILT_AT_10_CM |
% |
Percentage of silt in the soil at 10 cm depth |
|
CLAY_AT_10_CM |
% |
Percentage of clay in the soil at 10 cm depth |
|
TEXTURE_AT_10_CM |
|
Texture of the soil at 10 cm depth |
|
SOIL_TEXTURE_TOP_MINERAL_HORIZON |
|
Soil texture at the top of the mineral horizon |
|
WATER_GRAVIMETRIC_AT_10_CM |
% |
Gravimetric water content in the soil at 10 cm depth |
|
WATER_FIELD_CAPACITY_0_33_ATM_AT_10_CM |
% |
Percentage of moisture content in the soil at 10 cm depth at 15 atmospheres of pressure |
|
WATER_WILTING_POINT_15_ATM_AT_10_CM |
% |
Percentage of moisture content in the soil at 10 cm depth at 1/3 atmosphere of pressure |
|
ORGANIC_MATTER_AT_10_CM |
% |
Percentage of organic matter in the soil at 10 cm depth |
|
PH_PASTE_AT_10_CM |
|
PH of the soil at 10 cm depth |
|
SOIL_PH_TOP_OF_MINERAL_HORIZON |
|
PH of the soil at the top of the mineral horizon |
|
ELECTRICAL_CONDUCTIVITY_PASTE_AT_10_CM |
MMHOS/CM |
Electrical conductivity of the soil at 10 cm depth |
|
NO3_NH4HCO3_DTPA_EXTRACT_AT_10_CM |
PPM |
Extractable NO3-NH4HCO3 in the soil at 10 cm depth |
|
P_NH4HCO3_DTPA_EXTRACT_AT_10_CM |
PPM |
Extractable P in the soil at 10 cm depth |
|
K_NH4HCO3_DTPA_EXTRACT_AT_10_CM |
PPM |
Extractable K in the soil at 10 cm depth |
|
ZN_NH4HCO3_DTPA_EXTRACT_AT_10_CM |
PPM |
Extractable Zn in the soil at 10 cm depth |
|
FE_NH4HCO3_DTPA_EXTRACT_AT_10_CM |
PPM |
Extractable Fe in the soil at 10 cm depth |
|
MN_NH4HCO3_DTPA_EXTRACT_AT_10_CM |
PPM |
Extractable Mn in the soil at 10 cm depth |
|
CU_NH4HCO3_DTPA_EXTRACT_AT_10_CM |
PPM |
Extractable Cu in the soil at 10 cm depth |
|
CA_NH4OAC_EXTRACT_AT_10_CM |
MEQ/100 G |
Extractable Ca in the soil at 10 cm depth |
|
MG_NH4OAC_EXTRACT_AT_10_CM |
MEQ/100 G |
Extractable Mg in the soil at 10 cm depth |
|
NA_NH4OAC_EXTRACT_AT_10_CM |
MEQ/100 G |
Extractable Na in the soil at 10 cm depth |
|
K_NH4OAC_EXTRACT_AT_10_CM |
MEQ/100 G |
Extractable K in the soil at 10 cm depth |
|
CACO3_EQUIVALENT_AT_10_CM |
% |
CACO3 equivalent in the soil at 10 cm depth |
|
CATION_EXCHANGE_CAPACITY_AT_10_CM |
MEQ/100 G |
Cation exchange capacity of the soil at 10 cm depth |
|
P_BRAY_METHOD_AT_10_CM |
PPM |
Available P in the soil at 10 cm depth as detected by Bray method |
|
ELEVATION |
M |
Elevation of the plot |
|
PLOT_SIZE |
M^2 |
Size of the plot |
|
PLOT_SHAPE |
|
Shape of the plot |
|
SOIL_ORGANIC_DEPTH |
CM |
Depth of soil organic layer |
Table 5. Toolik_Lake_Species_Data.csv
| Column Numbers | Column Name | Units | Description |
| 1 | PASL_TAXON_SCIENTIFIC_NAME_NO_AUTHORS | Current Taxonomy according to the Panarctic Species List (PASL) includng authors names | |
| 2 | PASL_TAXON_SCIENTIFIC_NAME_WITH_AUTHOR(S) | Current Taxonomy according to the Panarctic Species List (PASL) | |
| 3 | DATASET_TAXON | Dataset taxonomy | |
| 4 to 84 | SWT1 to SWT81 | Column headings are all 81 plot numbers. The data values are Species Cover Classes (Braun-Blanquet cover-abundance scale): where r (rare), + (common, but less than 1 percent cover), 1 (1-5 percent), 2 (6 to 25 percent), 3 (25 to 50 percent), 4 (51 to 75 percent), 5 (76 to 100 percent). |
Companion Files: There is one companion file with this dataset in .pdf format.
Table 6. Companion files
| Companion File Name | Description |
|---|---|
|
Toolik_Lake_Veg_Plots_Report_WalkerBarry1991.pdf |
Summary report of all the data collected, methods of collection, maps/plots etc. for the 81 study plots at the Toolik Lake research site. Walker and Barry (1991). |
Application and Derivation
These data bring together for easy reference all the available information collected from the plots and have has been used for the classification, mapping and analysis of the geobotanical factors in the Toolik Lake region (Hobbie and Kling, 2014; Shippert et al., 1995; Walker et al, 1994; Walker et al., 1995 ). Derived regional maps of these data will be used in regional models of fluxes of trace gases, water, and energy from tundra surfaces. In addition, a circumpolar vegetation classification resulting from these datasets would be highly desirable to extend the results to the entire arctic region.
Quality Assessment
No specific quality assessment information provided.
Data Acquisition, Materials, and Methods
The eighty-one study plots at the Toolik Lake research site located in the southern Arctic Foothills of the Brooks Range, Alaska (shown in Figure 2) were subjectively located in 26 plant communities and 4 broad habitat types including: dry tundra (19 plots), snowbeds (7 plots), moist tundra (27 plots), and wet tundra (15 plots).
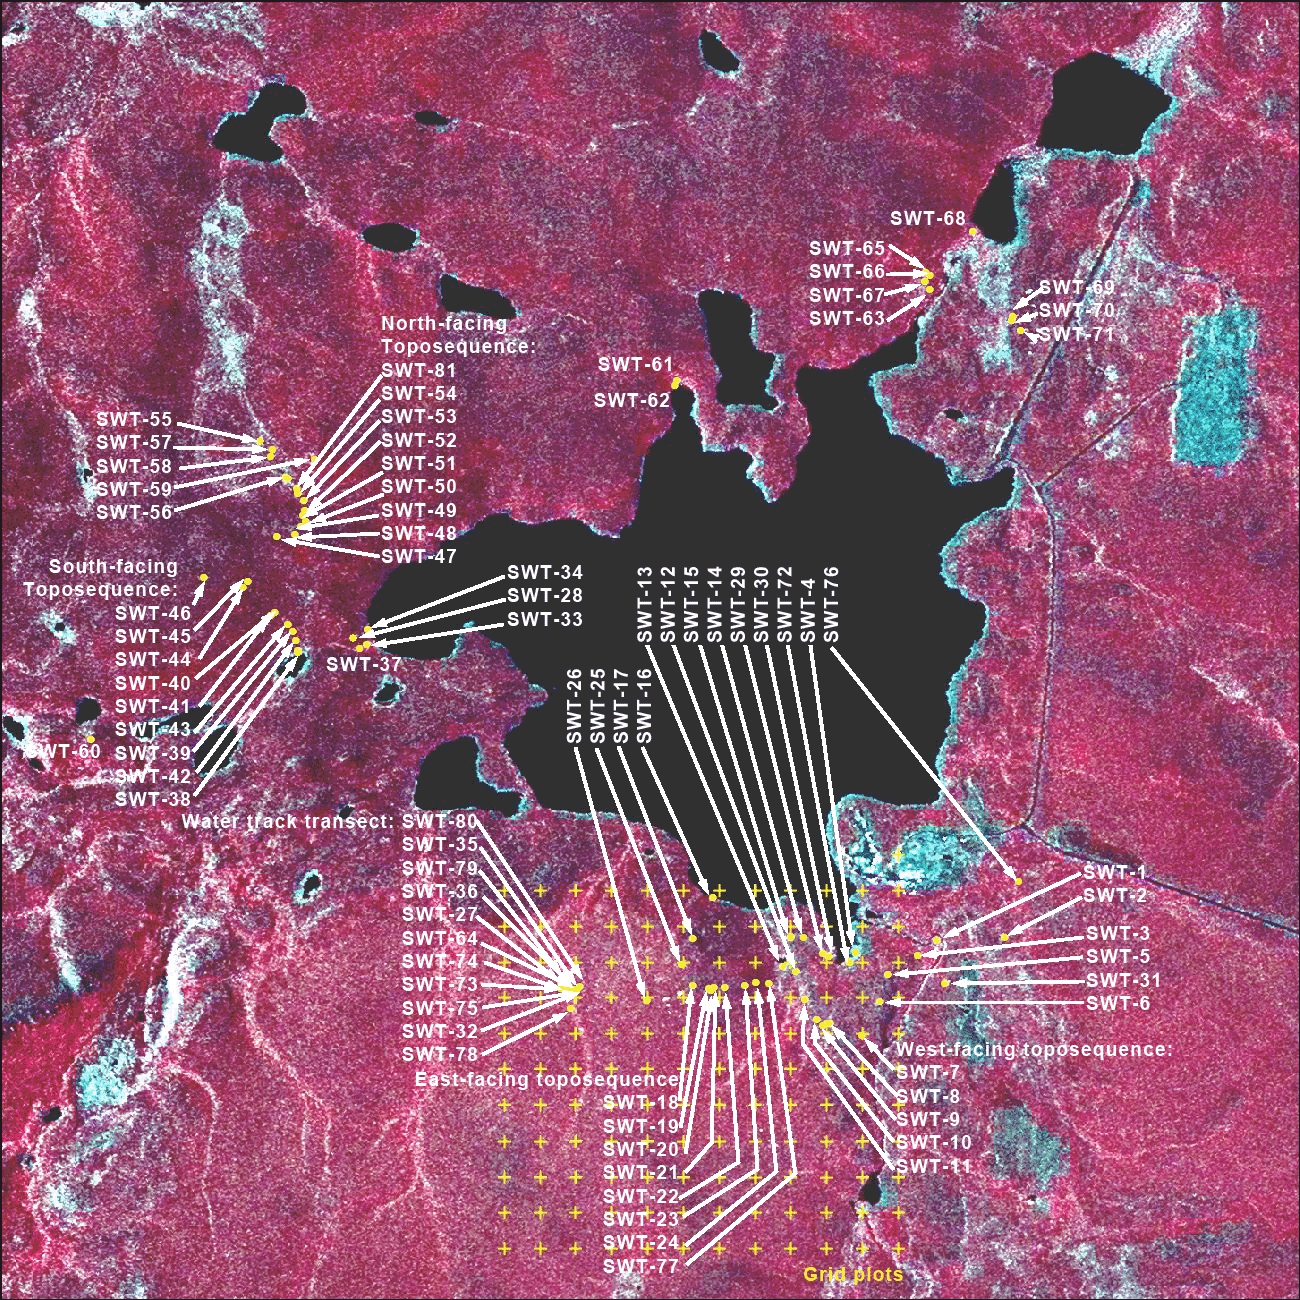
Figure 2. Location map of the 81 Toolik Lake Permanent Vegetation Plots.
Vegetation Plot Sampling
A formal relevé sampling of the designated plots was done during the period 1-24 August,1989 to sample the diversity of vegetation types of the region. For more details see Toolik_Lake_Veg_Plots_Report_WalkerBarry1991.pdf.
Sampling of the plots included:
- Taking photographs of the general site (Figure 1), vegetation (Figure 3), and soil profiles (Figure 4). Photos are provided in Walker and Barry (1991).
- Measuring site factors listed in listed in Table 4 plus measurements of thaw depth, estimates of cover of bare soil, rocks, and the major plant growth forms as summarized in Table 4.
- Field sampling of soils where soil pits were dug adjacent to the plots and described and classified according to the U.S. soil taxonomy [Walker and Barry, 1991]. Soil variables for each plot, typically at 10 cm depth was derived from the complete soils data in Table 2. Soil texture is primarily from the top mineral horizon per the soil text descriptions; secondarily from 10 cm, or listed as ‘organic’ when no mineral horizon is present.
- Laboratory analysis of soil samples
- Estimating vegetation cover using the Braun-Blanquet cover-abundance scale (r = rare; + = common but less than 1 % cover; 1 = 1-5%; 2 = 6-25%; 3 = 25-50%; 4 = 51-75%; 5 = 76-100%)
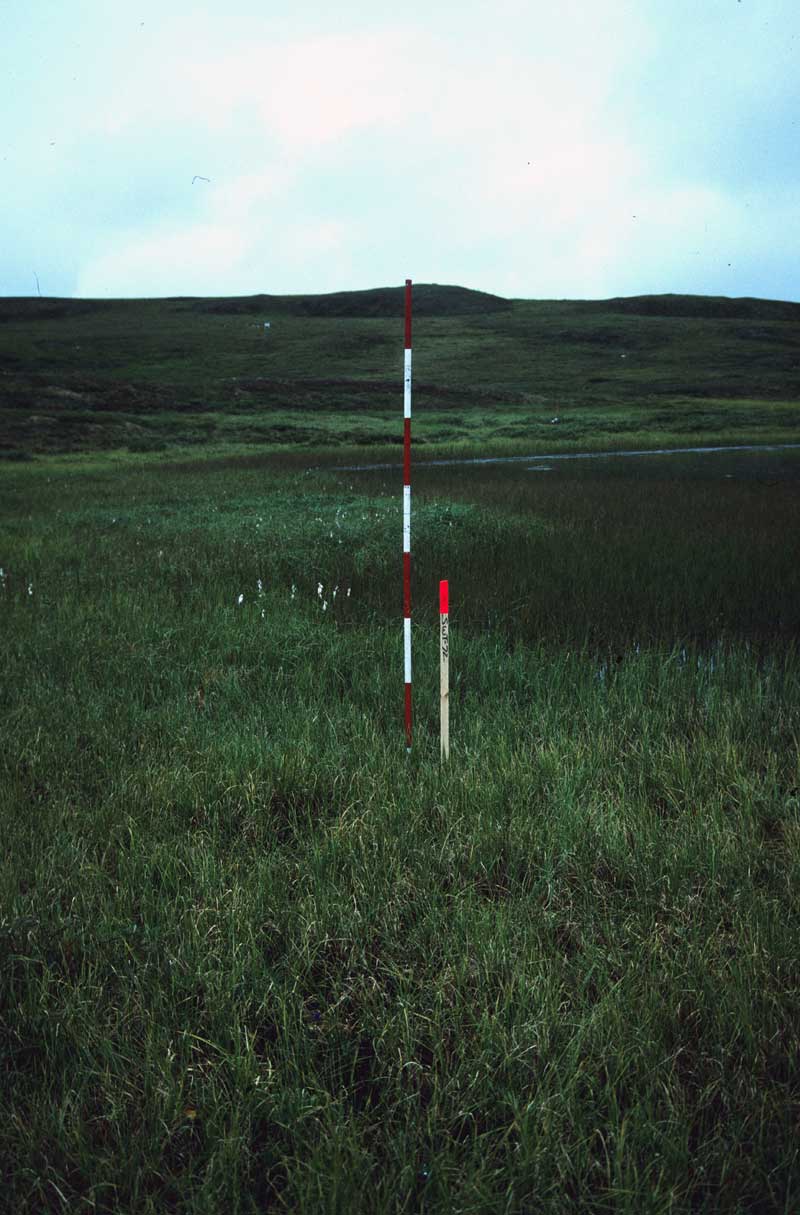
Figure 3. Vegetation at one of the Toolik Lake permanent plots (Plot SWT-72).
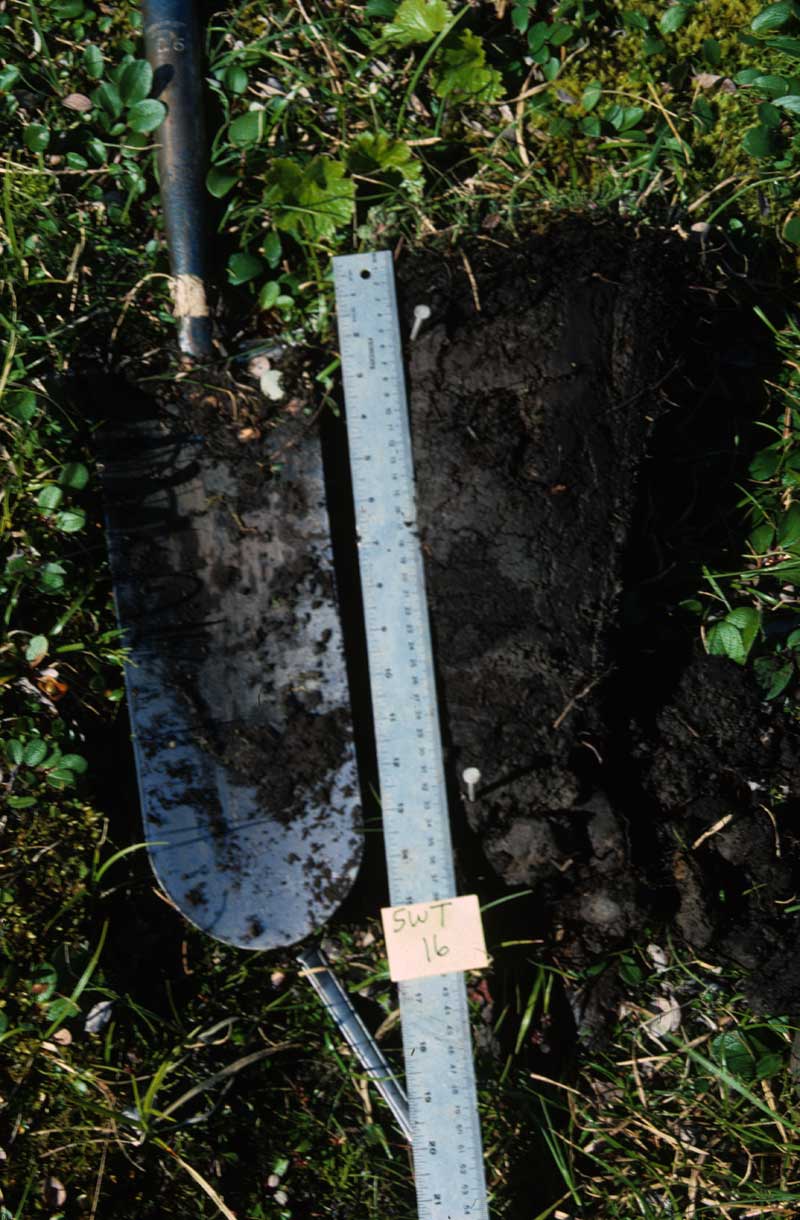
Figure 4. Soil profile at one of the Toolik Lake permanent plots (Plot SWT-16).
Data Access
These data are available through the Oak Ridge National Laboratory (ORNL) Distributed Active Archive Center (DAAC).
Arctic Vegetation Plots at Toolik Lake, Alaska, 1989
Contact for Data Center Access Information:
- E-mail: uso@daac.ornl.gov
- Telephone: +1 (865) 241-3952
References
Hobbie, J. E., & Kling, G. W. (Eds.). (2014). Alaska's changing Arctic: Ecological consequences for tundra, streams, and lakes. Oxford University Press.
Shippert, M. M., Walker, D. A., Auerbach, N. A., & Lewis, B. E. (1995). Biomass and leaf-area index maps derived from SPOT images for Toolik Lake and Imnavait Creek areas, Alaska. Polar Record, 31(177), 147-154.
Walker, D. A., F. J. A. Daniëls, I. Alsos, U. S. Bhatt, A. L. Breen, M. Buchhorn, H. Bültmann, L. A. Druckenmiller, M. E. Edwards, D. Ehrich, H. E. Epstein, W. A. Gould, R. A. Ims, M. H, M. K. Raynolds, J. Sibik, and S. S. Talbot. 2016a. Arctic vegetation: A hierarchic review of productivity, biodiversity patterns and an Arctic vegetation archive. Environmental Research Letters
Walker, D. A.; A. L. Breen; L. A. Druckenmiller; L. W. Wirth; W. Fisher; M. K. Raynolds; J. Šibík; M. D. Walker; S. Hennekens; K. Boggs; T. Boucher; M. Buchhorn; H. Bültmann; D. J. Cooper; F. J.A Daniëls; S. J. Davidson; J. J. Ebersole; S. C. Elmendorf; H. E. Epstein; W. A. Gould; R. D. Hollister; C. M. Iversen; M.T. Jorgenson; A. Kade; M. T. Lee; W. H. MacKenzie; R. K. Peet; J. L. Peirce; U. Schickhoff; V. L. Sloan; S. S. Talbot; C. E. Tweedie; S. Villarreal; P. J. Webber; D. Zona. The Alaska Arctic Vegetation Archive. 2016b. Phytocoenologia doi: http://dx.doi.org/10.1127/phyto/2016/0128
Walker, D.A. (Ed). Alaska Arctic Vegetation Archive Workshop, Boulder, Colorado, October 14-16, 2013. CAFF Proceedings Report #11. Akureyri, Iceland. ISBN: 978-9935-431-29-5.
Walker, D. A., A. L. Breen, M. K. Raynolds, and M. D. Walker, editors. 2013. Arctic Vegetation Archive Workshop, Krakow, Poland April 14-16, 2013. CAFF Proceedings Report #10. Akureyri, Iceland. ISBN: 978-9935-431-24-0.
Walker, D. A., and M. K. Raynolds. 2011. An International Arctic Vegetation Database: A foundation for panarctic biodiversity studies. CAFF Strategy Series Report nr. 5. Conservation of Arctic Flora and Fauna (CAFF), Akureyri, Iceland.
Walker, D. A., Auerbach, N. A., & Shippert, M. M. (1995). NDVI, biomass, and landscape evolution of glaciated terrain in northern Alaska. Polar Record, 31(177), 169-178.
Walker, M. D., Walker, D. A., & Auerbach, N. A. (1994). Plant communities of a tussock tundra landscape in the Brooks Range Foothills, Alaska. Journal of Vegetation Science, 5(6), 843-866.
Walker D.A. and Barry N. (1991). Toolik Lake permanent vegetation plots: site factors, soil physical and chemical properties, plant species cover, photographs, and soil descriptions. Data Report 48, Department of Energy R4D Program, Institute of Arctic and Alpine Research, University of Colorado, Boulder, CO.